Continuing to browse our website indicates your consent to our use of cookies. For more information, see our Privacy policy.

US-China trade

Is China’s growth narrative an illusion?


Published 11 July 2023

According to China’s official gross domestic output data, its economy is now 14% larger in real terms than it was prior to the pandemic. These statistics are puzzling. The Chinese economy, broken down by major sectoral engines, has stagnated since 2019 over years of malinvestment. Both structurally and cyclically, China’s economic growth and development model are severely challenged.

According to China’s official gross domestic output data, its economy is now 14% larger in real terms and 23% larger in nominal terms than it was prior to the pandemic.1 These statistics are puzzling. The experiences of other countries with far less draconian COVID policies make China’s purported growth a statistical outlier.

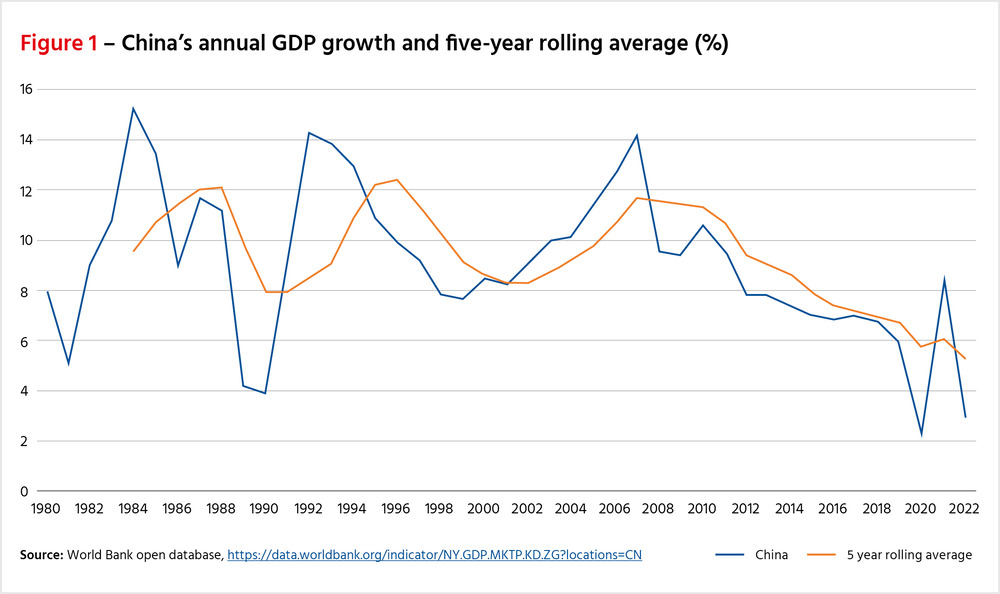
China’s economy, broken down by major sectoral engines, has stagnated since 2019. Property development was flat in 2022 from its 2019 level in nominal terms.2 Car production is below its 2017 level.3 Even going by official numbers, China’s economic growth has undergone a structural deceleration in the past decade. The chart below shows China’s official GDP growth rate on a five-year rolling average basis.

Figure 1 - China's annual GDP growth and five-year rolling average

Slowdown in China’s economic growth

The key cause of this slowdown in economic growth has been malinvestment in the Chinese economy. After years of running exceptionally high investment-to-GDP levels, largely intermediated through a state-owned financial system subject to the dictates of central planning, China’s bloated capital stock is producing less growth for every unit of investment.

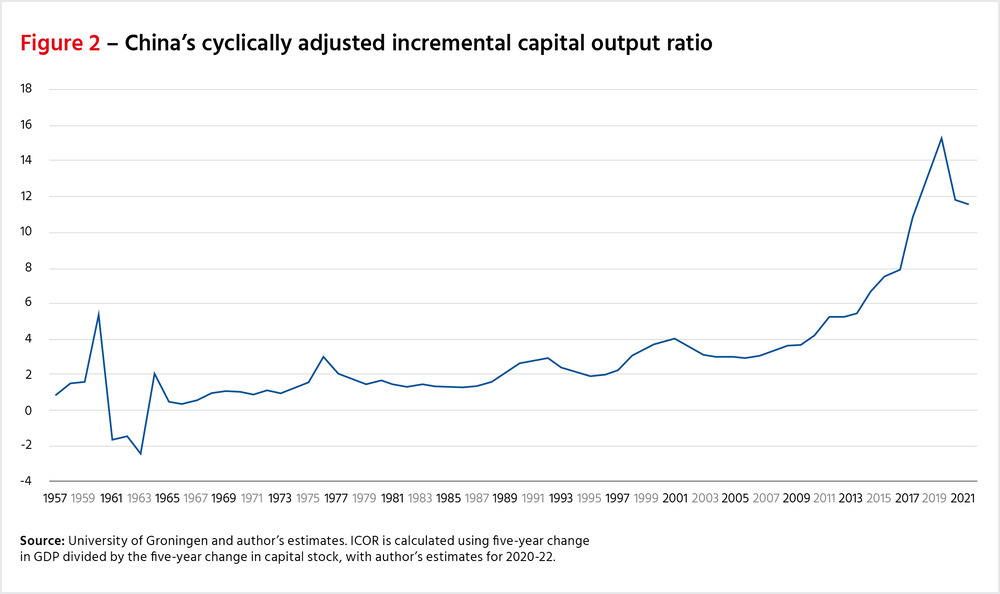
According to the Penn World Table, a national-accounts database developed by the University of California, Davis and the University of Groningen, China’s capital stock in 2019 was 4.84 times its GDP. As the chart below demonstrates, its incremental capital output ratio (the number of units of investment required to produce a unit of economic growth) has skyrocketed.

The implications are two-fold: China’s capital consumption (depreciation of capital) as a percentage of GDP now exceeds 25% of GDP and is still rising, hence an increasing proportion of China’s gross investment is simply replacing depleted capital stock. In addition, capital stock growth is slowing and the approximate 45% of GDP that China invests each year can only be expected to generate 2-3% growth going forward even if there is a modest improvement in capital efficiency.

Figure 2 - China's cyclically adjusted incremental capital output ratio

China’s investment-led growth model appears to have hit a brick wall. The obvious option is to elevate the importance of the household sector and re-orient the economy toward a more consumer-driven model. China’s economic planners have been trying to pull this off for years.

Unfortunately, consumer spending isn’t responding to the best-laid plans of a centrally planned economy. Market efficiencies are liable to be dampened by policies of control, which China’s ruling Communist Party has emphasized by a series of tech crackdowns at home and geopolitical loggerheads with the West and its allies abroad. China’s shrinking work force and aging population will only add to the drags on growth. From holiday travel to shopping for cars and homes, the macroeconomic data shows Chinese people are now just afraid to open their wallets too widely.

From a purely cyclical perspective, in the past nine months, sentiment towards China’s growth prospects has swung wildly: from despair at the impact of the COVID-related lockdowns to euphoria at a fledgling boom induced by pent-up demand, and back to gloom over the dissipation of the rebound. Capital market performance stands as testimony to this rollercoaster.

Youth unemployment at 20.4% is not a sign of a booming economy. Shrinking exports – down 7.5% year-on-year in May and flat year-to-date – put a dent in one of China’s main growth engines. Contracting imports suggest China’s post-COVID rebound was ephemeral.4

While sales of consumer goods were up 18.4% in April 2023 year-on-year, they have been rising from a low base last year, when full-year spending was down 11.1% from 2021.5 The purchasing managers’ index, a measure of manufacturing performance, has been deteriorating since highs in February and now indicate economic contraction.

So, both structurally and cyclically, China’s economic growth is severely challenged. The prospect of poor economic performance undermines the Chinese Communist Party’s reorientation of policy goals toward “national rejuvenation” as a source of its political legitimacy.

The promise of jam tomorrow

A large part of China’s growing influence in the world can be attributed to the narrative around the country’s economic performance and particularly its growth prospects – the promise of jam tomorrow has been a major factor in inducing investment from the foreign private sector. From the rest of the world’s perspective, there are probably four key measures of the importance of China that determine its global influence: China’s ability to export to the rest of the world either at compelling prices or goods that simply cannot be sourced elsewhere; China’s investment flows to the rest of the world; China as an import destination; and the profitability of Chinese operations of foreign companies supplying China’s domestic market.

Clearly, China’s economic growth (and specifically growth in domestic final demand) is a key determinant of the attractiveness of China as both an export market for foreigners and a destination for multinational corporations (MNCs) to base operations aimed at supplying the domestic market. In value terms, China’s imports have grown dramatically from pandemic lows of 2020 when they were US$2.07 trillion to the highs of 2022 when they reached US$2.72 trillion.6 However, this 32% growth is largely due to higher commodity prices. According to the United Nations Conference on Trade and Development (UNCTAD), import volume growth rose just 1% between the final quarters of 2020 and 2022.7

A slightly longer-term analysis of China’s growth as an import market for the rest of the world is revealing. In the eight years between 2014 and 2022, China’s total imports grew from US$1.9 trillion to US$2.72 trillion – 38% in total but a compound annual growth rate (CAGR) of just 4.2% in nominal US dollar terms.8 Bear in mind that over the same timeframe, US inflation went up 24.6% or at a CAGR of 2.7%, so exports to China grew by just 1.5% in real terms.9

Furthermore, out of 215 trade jurisdictions, 64 saw their exports to China shrink in nominal terms over the last eight years and a further 15 saw their exports shrink in real terms including Japan, the United States, Singapore, and the Philippines.10 11

Tellingly, with the exception of Vietnam, the countries that have exported the most to China are all commodity producers: Russia, Brazil, Australia, Malaysia, Saudi Arabia, United Arab Emirates, and Chile.

In addition, issues such as China’s sweeping national security law and Beijing’s demands to install Communist Party committees on company boards are making the business climate in China more challenging for MNCs on the ground. This is diminishing the appeal of the Chinese market.

The new normal

China’s growing current account surpluses imply a rise in net capital exports. However, as foreign investors have turned net sellers of Chinese financial assets and as FDI inflows moderate, China’s gross capital exports have moderated.

China’s capital exports, which were mainly invested in foreign reserves until 2010, have more recently been used to purchase influence through the state’s Belt and Road Initiative (BRI) to build a web of global infrastructure. From a peak of US$1 trillion, the four-quarter rolling total has moderated substantially in the past year and a half.

This macroeconomically derived indicator is supported by microeconomic analysis. According to the China Global Investment Tracker, total investment from China in 2021 and 2022 is running at about half the level of 2018 and 2019.12 The implication is that China is becoming less relevant in aggregate as a supplier of capital to the rest of the world.

The final metric of significance is China’s role as a supplier of goods, either at compelling value or from a position of monopolistic power. China commands about 14% of global exports, about the same as the United States and Germany combined. However, there are signs that this share may be peaking, declining to 14.4% last year from 15.1% in 2021.13 The increased use of industrial policy in the United States and the European Union to reduce trade dependency on China in critical industries might lead to further declines in China’s market share. Importantly, this may deal a further blow to China’s monopolistic power in key global industries.

Conclusion

A key part of China’s ability to circumvent international trade norms has been the seeming invulnerability of its narrative and the success of its economic system. China’s outsized contribution to global growth since the global financial crisis has added credibility to the idea that the future prospects for prosperity for many countries lie in closer alignment and deeper economic engagement with China. This in turn has produced a reluctance on the part of many countries to push back against China’s mercantilist economic policies and some of its more expansionary and coercive geopolitical ambitions and actions.

If, as seems possible, the economic reality in China is suggesting a significantly poorer economic outlook, then there is a prospect of a complete reappraisal from the international community of the desirability of close economic alignment. This, combined with the realization that the multilateral rule-based system is a desirable ecosystem for middle powers and developing nations, has the potential to reinvigorate efforts to reform and sustain the institutions that oversee it.

***
[1] China National bureau of statistics
[2] China National bureau of statistics
[3] https://www.statista.com/statistics/281133/car-production-in-china/ and http://en.caam.org.cn/
[4] China national bureau of statistics
[5] China National Bureau of Statistics
[6] https://data.worldbank.org/indicator/TM.VAL.MRCH.CD.WT?locations=CN
[7] https://unctadstat.unctad.org/wds/TableViewer/tableView.aspx
[8] https://data.worldbank.org/indicator/TM.VAL.MRCH.CD.WT?locations=CN
[9] https://data.worldbank.org/indicator/FP.CPI.TOTL?locations=US
[10] Comtrade database and author’s calculations
[11] ibid
[12] https://www.aei.org/china-global-investment-tracker
[13] https://data.worldbank.org/indicator/TX.VAL.MRCH.CD.WT?locations=US-CN-1W

© The Hinrich Foundation. See our website Terms and conditions for our copyright and reprint policy. All statements of fact and the views, conclusions and recommendations expressed in this publication are the sole responsibility of the author(s).


Author

Stewart Paterson

Stewart Paterson is a Research Fellow at the Hinrich Foundation who spent 25 years in capital markets as an equity researcher, strategist and fund manager, working for Credit Suisse, CLSA and most recently, as a Partner and Portfolio Manager of Tiburon Partners LLP.

Articles by this expert

View bio

Have any feedback on this article?

contact us