How to use it
World Investment Report 2022: International Tax Reforms and Sustainable Investment
Published 26 October 2022
In a year with many weighty economic and geopolitical developments, tracking and understanding investment flows take on new importance. Combined with its focus this year on impending international tax reforms under the OECD’s Pillar II disciplines, the analysis contained in the United Nations Conference on Trade and Development (UNCTAD) World Investment Report 2022 (the 2022 Report) becomes even more valuable.
Here’s how to use the report entitled World Investment Report 2022: International Tax Reforms and Sustainable Investment.
Why is the 2022 report important?
The 2022 Report tracks global and regional investment trends, allowing policymakers to easily understand how investment flows and investment rules and policies are growing or changing.
The 2022 Report is especially significant in its focus on upcoming reforms to international taxation rules and incentives for foreign investment, due to the widespread adoption and implementation of a new OECD agreement to institute a global minimum tax on large multinational enterprises (MNEs).
The 2022 Report includes an executive summary of key messages, followed by four chapters:
Global Investment Trends and Prospects (3 sections)
- Investment trends, including global, regional, type, and sector trends;
Investment trends relating to climate change and sustainable development goals; and
International production, including key indicators and internationalization trends.
Recent Policy Developments and Key Issues (3 sections)
National investment policies;
International investment policies; and
Key trends in taxation of investments.
- The Impact of a Global Minimum Tax on FDI (4 sections)
-
How a minimum tax affects FDI–a theoretical framework, including the mechanics of Pillar II (an OECD-proposed global minimum tax on the profits of SMEs);
-
Estimating the impact of Pillar II on FDI;
-
Implications of Pillar II for tax incentives; and
-
Reshaping investment policy for a global minimum tax environment.
-
-
Capital Markets and Sustainable Finance (5 sections)
-
Sustainability-themed capital market products;
-
Institutional investors, discussing their policies and strategies for sustainable investing;
-
Stock exchanges and market infrastructure, covering how exchanges advance sustainable investing and gender equality;
-
Policies, regulations and standards on sustainable finance; and
-
Climate action, discussing carbon emissions in public markets.
-
Chapter I: Global Investment Trends and Prospects | Chapter II: Recent Policy Developments and Key Issues | Chapter III: The Impact of a Global Minimum Tax on FDI | Chapter IV: Capital Markets and Sustainable Finance
Chapter I: Global Investment Trends and Prospects
Global Trends
- Global foreign direct investment (FDI) flows in 2021 increased to $1.58 trillion, up 64% from 2020. (p. 2)
- However, the global investment environment has changed dramatically in 2022 with the war in Ukraine, the negative effects of China’s zero Covid policies, and significant rises in inflation globally. (pp. 2-3)
- These changes are likely to cause investor uncertainty and interest rate increases, leading to lower global FDI in 2022. Early indicators from early 2022 appear to confirm this trend. (pp. 2-4)
Regional Trends
- FDI flows in 2021 recovered strongly in all regions, with the increase in flows to developed economies accounting for most of the growth. (p. 7, Figure I.5, Table II.3) FDI in most developed economies increased, largely due to financial flows from corporate restructurings, mergers and acquisitions (M&A), and strong fluctuations in conduit FDI. (p. 8)
- The United States was by far the largest recipient of FDI, followed by China, Hong Kong, Singapore, and Canada. (p. 9, Figure I.7)

- In 2021, FDI to developing economies increased by 30 percent from 2020, due to strong growth in developing Asia, recovery in Latin America and the Caribbean, and an upswing in Africa. (p. 11)
- Developing Asia is the largest recipient region of FDI in the world, accounting for 40 percent of global inflows. (p. 13)
- In 2022, FDI trends to developed economies are uncertain, while FDI flows to developing economies will likely endure strong negative effects due to the impact of the war in Ukraine and rising interest rates. (p. 12)
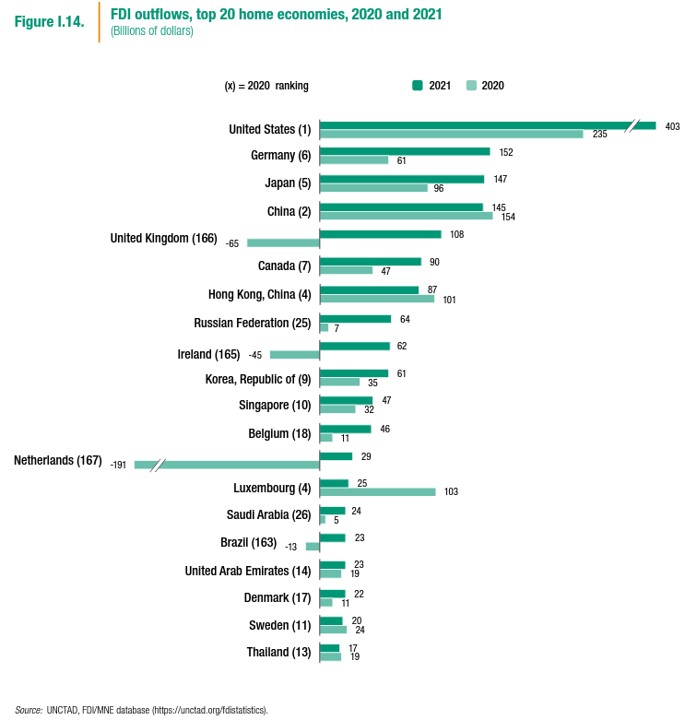
- 2021 FDI outflows from developed economies rose to US$1.3 trillion from US$408 billion a year earlier. The United States, Germany, Japan, China, and the United Kingdom were the top five sources of outbound FDI. (pp. 20-21, Figure I.14)
Trends by Type and Sector
- In 2021, cross-border M&A transactions, announced greenfield projects, and project finance deals all increased in value and in number, though recovery of greenfield projects was more moderate and stagnant with respect to developing countries. (p. 22)
- 2021 international project finance activity grew by 68 percent over 2020 levels to 2,115 projects, driven by investments in renewable energy. The value of projects rose above US$1 trillion for the first time ever. (pp. 23-24)
- Cross-border M&A hit US$728 billion in 2021, up 53% compared to 2020. In services, cross-border M&A doubled to US$461 billion. (p. 25)
Sustainable Development Goals and Climate Change Investment Trends
- Investment in SDG-related sectors increased by 70 percent in 2021 compared to 2020, driven mostly by project finance investments in renewable energy. (p. 26)
- Climate change investments fall into two categories: mitigation investments into cleaner or more energy efficient technologies, and adaptation investments directed to improve resilience and adapt to the consequences of climate change. Mitigation projects, largely renewable energy and energy efficient projects, comprise 95 percent of international climate investments. (pp. 33-34)
Key Indicators of International Production
- International production gained strength in 2021, with all indicators of FDI rising, and with FDI stock reaching US$45 trillion, or almost half of global GDP. (p. 39, Table I.16)
Internationalization Trends of the Largest MNEs, Digital MNEs, and SMEs
- 2021 saw increased internationalization of the world’s top 100 MNEs, mostly related to sales, due to high demand in specific sectors like healthcare and construction materials. (p. 40)
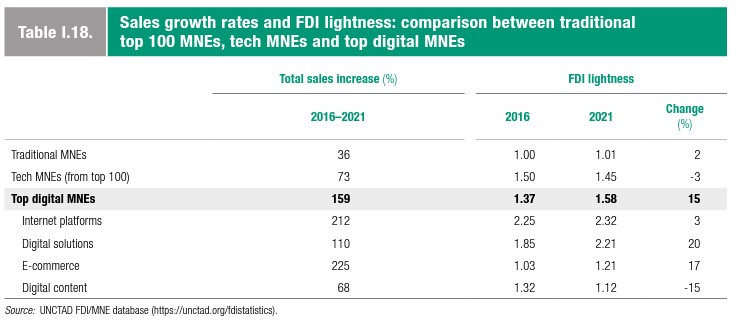
- Digital MNEs need little investment in physical assets to do business across borders. From 2016 to 2021, sales of UNCTAD’s top 100 digital MNEs grew five times faster than sales of traditional MNEs. (pp. 42-43, Table I.18)
- Only the most dynamic and productive small- and medium-sized enterprises (SMEs) invest abroad, and, even so, SME investment activity has declined from 880 projects in 2015 to only 195 in 2021. (p. 47)
How to apply the insights
- This initial chapter provides baseline information characterizing the current and future state of global investment flows from a range of perspectives. It also highlights UNCTAD’s findings regarding the impact of investment on the ability of economies to meet sustainable development goals and mitigate climate change.
- Policymakers can use this chapter to quickly gain an understanding of the state of their and their region’s economies and the projections for the coming year to know how to adjust policies to attract greater FDI, or prepare for a reality where there is not enough FDI to support their development goals.
Chapter II: Recent Policy Developments and Key Issues
National Investment Policies
- 2021 saw a decrease in investment policy measures by 28 percent compared to 2020, reflecting a retreat from emergency policymaking due to the Covid pandemic. (p. 56)
- Developed countries continue to tighten investment regulations to restrict foreign ownership of critical assets, increasing the ratio of unfavorable-to-favorable measures to a high of 42 percent. Four more countries adopted new investment screening mechanisms, while at least eight countries tightened existing investment screening rules. (pp. 56, 58)
- Developing countries continue to liberalize their investment regimes, reflecting the importance of FDI in their economic recovery. Asian countries were the most active in liberalizing investment. (pp. 57, 62)
- Q1 2022 saw a dramatic rise in new investment policy measures mostly due to sanctions and countersanctions because of the war in Ukraine. 27 countries plus the EU adopted 75 policy measures affecting foreign investment. (p. 58)
International Investment Policies
- 2021 and 2022 have so far seen serious efforts to reform the international investment agreements regime, including the conclusion of significant new “megaregional” economic agreements, the termination of bilateral investment treaties (BITs), and multilateral discussions of ISDS mechanisms. (p. 65)
- Megaregional agreements that address investment as one of a range of issues may have a more substantial positive impact on FDI flows and greater political relevance than BITs, which are focused entirely on investment. (p. 69, Table II.2)
Key Trends in Taxation of Investments
- Tax policy is a key instrument to promote investment; (p. 54)
- Countries rely intensively on tax incentives for investment; profit-based incentives (tax relief based on earnings) are the most accepted and frequently adopted incentives, while expenditure-based incentives (investment allowances and tax credits) are less common. They are often used in combination with other tax and non-tax incentives. (p. 76, 81)
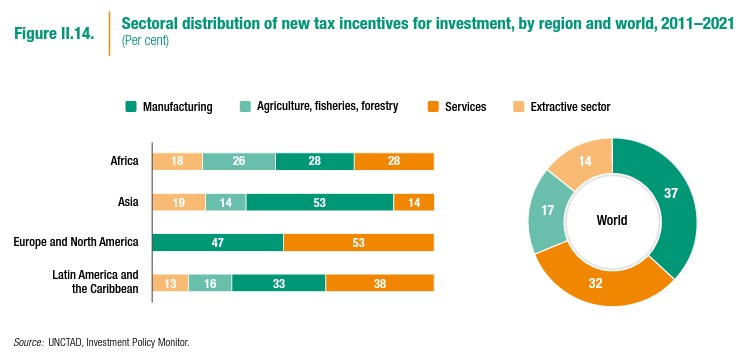
- Globally, 57 percent of all tax incentives related to investment target specific sectors in services or manufacturing. (pp. 81-82, Figure II.14)
- 60 percent of tax-related measures favorable to investment are associated with particular policy objectives, like export promotion, employment promotion, or R&D and innovation. (p. 82, Figure II.15)
- Asia leads the world in adopting investment-related tax measures favorable to investment. (p. 78, Figure II.10)
- International investment agreements can introduce obligations that create friction with domestic tax measures and these agreements can come into play when domestic measures affect foreign investors and investments. (pp. 87-90, Figure II.3).
How to apply the insights
- Researchers and policy makers can look to this chapter to understand how laws, policies, international agreements, and the international tax system are shaping investment flows in 2022. This chapter analyzes and catalogues developments at the national level with specific examples of investment restrictions and cross-border transactions, as well as lists of new country-specific rules that encourage investment.
- In addition, this chapter includes a very useful section summarizing megaregional trade agreements and how provisions covering e-commerce, IP rights, procurement, competition, and supply chains can positively affect investment flows.
- Lastly, the chapter dives deep into how domestic tax policies incentivize foreign investment, including what tax tools are most commonly used, and digs into the nexus of international agreements and domestic tax laws, including the use of double-taxation treaties (see pp. 87-96, Table II.4).
- The chapter also gives an overview of the international system, but with enough depth, analysis and anecdote to constitute a very useful resource for anyone needing to understand these aspects of investment.
Chapter III: The Impact of a Global Minimum Tax on FDI
- In 2020, participants in the action plan on Base Erosion and Profit Shifting (BEPS) agreed on a two-pillar approach – Pillar I’s goal is to realign the reporting of MNE profits with value creation and Pillar II proposes a global minimum tax on the profits of MNE groups with revenues of over €750 million. (p. 100)
- MNEs with consolidated revenues over €750 million accounted for more than two-thirds of new investment projects over the past five years, with even higher shares in developing nations. (p. 153, Figure III.18)

- Pillar I is designed to reduce profit shifting and lead to a fairer distribution of tax revenues and is not expected to affect investment decisions significantly. (p. 101)
- Pillar II could have far-reaching consequences for FDI recipient countries and for economies that compete to attract inbound FDI through fiscal measures. 140 jurisdictions have accepted Pillar II in principle, representing 95 percent of global FDI stock. (p. 101, 143)
How a Minimum Tax Affects FDI – A Theoretical Framework
- Corporate tax policies affect the location and scale of a given investment. (p. 103, Table III.1)
MNEs determine where to invest based on a location’s average effective tax rate (AETR) – the proportion of the pre-tax profit it generates that a location will take in tax. (p. 104) - MNEs decide how much to invest by determining the point at which the additional profit net of additional tax owed just covers the return the MNE requires. (p. 104)
- MNEs engage in profit-shifting, the practice of using artificial transactions and arrangements, to move their tax base from higher- to lower-tax economies, which can significantly affect the location and scale of investments. (p. 105)
- Pillar II requires economies to change their tax rules to ensure that targeted MNEs pay a tax equal to at least 15 percent of profits exceeding a certain amount related to indicators of activity in the economy. (p. 107)
Estimating the Impact of Pillar II on FDI
- Tax competition for investment has led to lower corporate tax rates, which are now on average around 25 percent in both developed and developing countries. (pp. 106, 111)
- Effective tax rates (ETRs) do not reflect actual tax rates MNEs pay because of profit shifting to areas with lower ETRs. (p. 116)
- Under Pillar II, MNEs will pay higher corporate income tax rates, and will reduce profit shifting practices as the advantages in doing so will lessen, and they will pay more taxes to their host countries. (pp. 118-126)
- Pillar II will likely reduce investment volumes, given higher tax liabilities faced by MNEs, create stronger incentives to invest in higher-tax locations, and reduce conduit FDI – investment routed through special purpose entities. (pp. 126-127)
Implications of Pillar II for Tax Incentives
- Under Pillar II, all economies will have to reconsider their tax incentive systems as tax incentives can reduce the average ETR below the required minimum of 15 percent. Some tax exemptions currently on offer will be negated by the Pillar II disciplines. (pp. 131, 138, Table III.2)
- Although Pillar II has significant effects on tax incentives to attract FDI, it also allows economies to adopt a wide range of alternative non-tax measures, or to lower other kinds of taxes, to attract investment. (pp. 131, 135)
- The diversity of tax incentive structures globally means that the impact of Pillar II reforms will fall unevenly across economies and firms. (p. 131)
Reshaping Investment Policy for a Global Minimum Tax Environment
- Pillar II will require policymakers to seriously rethink their investment policy toolkits and evaluate what will work and what will not under Pillar II disciplines. (pp. 142-143, Table III.3)
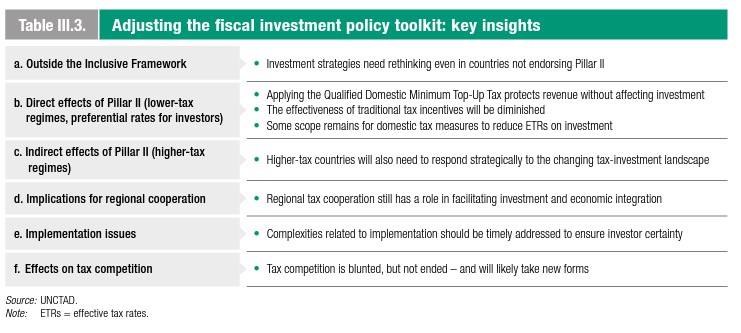
- Economies that do not adopt Pillar II disciplines will still likely experience an impact on their investment environment, while higher-tax economies need to respond strategically to the changing landscape. (pp. 143, 147-148)
- Applying a qualified domestic minimum top-up tax protects revenue without affecting investment. (p. 144)
- Pillar II will diminish the effectiveness of traditional tax incentives but scope will remain for domestic tax measures, including refundable tax credits and reducing non-covered taxes, to reduce effective tax rates on investment. (pp. 145-147)
- Tax competition is blunted, but not ended; scope remains for reshaping domestic tax regimes to encourage foreign investment. (p. 150)
How to apply the insights:
- To make new policies and change tax laws, government officials need high quality information that explains how their economies will be affected by the reforms. Adopting OECD Pillar II disciplines will mean a significant adjustment in corporate tax treatment for many economies and it will have a serious impact on their abilities to attract foreign investment.
- This chapter provides both an analytical framework for the use of future policymakers, and a detailed analysis that lawmakers and policymakers can look to, to inform their decision making. Beyond the analytic framework provided, this chapter also includes recommendations for what investment promotion authorities and managers of special economic zones should consider as the global minimum tax rules come into effect (see p. 152, Box III.10), and highlights the need for resources and monitoring of the implementation in order for the promise of Pillar II disciplines to come to fruition.
Chapter IV: Capital Markets and Sustainable Finance
Sustainability-Themed Capital Market Products
- In 2021, the total estimated value of sustainable finance products was US$5.2 trillion, up by 63 percent from 2020, as sustainability concerns grew with the increasing and apparent impacts of climate change and the war in Ukraine spurred reflection on the energy transition. (p. 162)
- The number of sustainable funds reached 5,932 by the end of 2021, up 61 percent from 2020; total assets under management reached US$2.7 trillion, an increase of 53% year-on-year. (pp. 164-165, Figures IV.1 and IV.2)

- To tap into the full potential of the sustainable fund market, international cooperation is needed to enhance interoperability and harmonization of regulations and standards across economies. (p. 166)
- Sustainable funds are still a developed-market phenomenon, as developing economies face barriers to developing their own sustainable fund markets or benefitting from the international sustainable fund market due to limited market sizes and perceptions of high risk in their capital markets. (p. 166)
Institutional Investors
- Institutional investors, like pension and sovereign wealth funds, are in a strong position to drive sustainability integration in capital markets, in light of the size of their total assets under management. (p. 175)
- In 2021, public pension funds held more than US$22 trillion in assets, or almost 40 percent of global pension fund assets. Sovereign wealth fund assets grew to US$11 trillion. (p. 175)
- More than half of the 100 largest public pension and sovereign wealth funds do not disclose or report on sustainability issues; national regulations are required to improve such reporting. (p. 178)
Stock Exchanges and Market Infrastructure
- Exchanges play an important role in promoting sustainable finance, especially through environmental, social, and governance (ESG) disclosures, as well as gender equality. (pp. 179-180, 182)
Policies, Regulations and Standards
- 35 developed and developing economies had 316 sustainable finance-dedicated policy measures and regulations in force by the end of 2021. (p. 184, Table IV.2)
- Sustainable finance policies and regulations must be undertaken in a holistic way, integrating regulations to create coherence and consistency. (p. 192)
- In late 2021 and early 2022, the world witnessed a major consolidation of ESG disclosure standards, frameworks, and tools, with the formation of the International Sustainability Standards Board and the International Financial Reporting Standards Foundation. (p. 191)
Climate Action
- Capital market participants are working to decarbonize and embed climate-conscious decision-making into their activities. (p. 193)
- Tools include tracking carbon emissions of listed companies (Figure IV.22), creation of the “Race to Zero” initiative to spur cities, companies, and investors to achieve net zero carbon emissions (Figure IV.23), public pension and sovereign wealth fund initiatives to identify and mitigate the impact of climate change on future returns (pp. 196-197), and stock exchange strategies to train companies on climate-related disclosures (p. 198).
How to apply the insights:
- Investors, researchers, and policy-makers who are interested in green and sustainable finance can look to this chapter to quickly grasp the state-of-play in capital markets and with government policies and regulations in this sector.
- This chapter is especially useful for understanding how stock exchanges and major institutional investors can help to combat climate change and reduce carbon emissions through the tools available to them, including strategic investments, more rigorous disclosure requirements, and more demanding rules for what constitute “green” and sustainable projects.
Conclusion
UNCTAD’s World Investment Report 2022 provides an excellent summary of key developments in policies, regulations, laws, and international agreements over the past year, and issues expected to arise in this area in the future. The 2022 Report is also an invaluable resource for anyone who wants to understand the meaning and impact on FDI of the OECD agreement on a global minimum tax. Lastly, as sustainable finance increasingly becomes a focal point for investors and institutions, reports like this one are important for keeping up-to-date on the latest state of play.
© The Hinrich Foundation. See our website Terms and conditions for our copyright and reprint policy. All statements of fact and the views, conclusions and recommendations expressed in this publication are the sole responsibility of the author(s).