Published 05 September 2023
Understanding why China’s households consume so sparingly is crucial to understanding the impact and risks inherent in China’s external economic relations, including the potential for its export-oriented industrial overcapacity to roil global trade. Beijing is hoping for domestic consumption to rescue the country's economic slowdown, but it is the Chinese state’s mercantilist economic structure that is at the heart of its economic malaise.
As China opened up its economy after the COVID-19 lock down, hopes were high that the economy would boom off the back of a consumer binge as households spent their excess savings to meet pent-up demand.
In April 2023, year-on-year growth in retail sales of consumer goods reached 18.4%. However, the boom was a function of the low base from a contraction in the previous year of 11.1%. As of July 2023, retail sales were growing just 2.5% year-on-year down from 2.7%. Nominal retail sales suggest the boom swiftly faded. Consumption growth appears to be stabilizing at a level well below where many economists have been forecasting China’s sustainable gross domestic product growth would be.
Should we be surprised? After all China accounts for about 18% of world economic output but only about 13% of global consumption.1
Understanding why China’s households consume so little is crucial to understanding what could be done to make China’s external economic relations less contentious – at least from an economic perspective if not a geopolitical one. China’s industrial overcapacity in major sectors from car batteries and automotive brakes to steel and cement have over the last 15 years increasingly become and remains a major source of global trade friction. If consumer spending can’t reverse a slowdown in the Chinese economy, the risk of such overcapacity flooding global markets would pose additional risks to macroeconomic stability worldwide.

When one examines final consumption expenditure in the United States, Japan and China, three things are striking about it. First is the remarkable stability of final consumption expenditure in the United States that has oscillated between 75% and 85% of GDP for 50 years. Second is the gradual convergence of Japan’s consumption on the United States’, despite the similarity of Japan’s political economy with China (absent the authoritarianism), as rising affluence drove consumption expenditure. Finally, China’s consumption is moving, in stark contrast, in the opposite direction from the largest and third-largest economies in the world, and China's final consumption expenditure relative to GDP is now lower than Japan’s has ever been in the past 50 years.
Total final consumption expenditure can be broken down into two segments: government final consumption expenditure and household final consumption expenditure. As Figure 1 below shows, China’s government consumption expenditure has been on a rising trend relative to its GDP and is not much lower than that for Japan (six percentage points of GDP) and is actually above the level in the United States.
![]()
The big difference between China and world norms comes from the lack of household final consumption expenditure. As Figure 2 shows, not only is the gap now huge, it has also been growing over the period of China’s integration into the global economy. In 2021, China’s household consumption spending accounted for 38% of GDP versus 54% in Japan (a gap of 16 percentage points of GDP) and 68% in the United States (a gap of 30 percentage points of GDP).
![]()
From a global trade perspective, trade imbalances are driven by or reflect savings and investment imbalances. China’s perennial current account surpluses reflect the excess savings over and above its unusually high investment levels.
So why do China’s households consume so little?
There are two factors at play here. The first is that the household sector in China accounts for a smaller share of economic value-added than in other major economies. In 2019, US disposable household income accounted for about 77% of GDP.2 The equivalent ratio in China was 60%.3
The second is that Chinese households save a lot. The household savings rate in China – in excess of 30% over the past 20 years – is some six times higher than in the euro zone (5-6% in the decade to the pandemic) or the United States.
Understanding the factors at work behind the relatively low share of household savings to GDP in China and the high propensity to save is key to understanding why China consumes so little and what might be done to change that.
China households’ small share of GDP relative to the rest of the world
The good news is that the Chinese household’s share of GDP has been rising since 2007. From a low of 55.3% in 2007, it grew to 60.3% in 2019.4 This takes the share back to a level not seen since 2003. The further two percentage point jump in 2020 reflects the Covid impact, given that wages and salaries in a downturn tend to be more stable than corporate profits, they tend to rise as a share of GDP during such times. The upward trend is encouraging.
But why does the household sector share of GDP fall so far short of other major economies? It is important to note that there are significant differences between the Chinese flow of funds data (meaning transfers between the government sector, corporates, and households) and the US personal income and expenditure data. Direct comparisons need to be made with caution. We should also note that data on the flow of funds in China presents information differently from the more timely household survey data on household income and expenditure in China, particularly the netting of taxes and social contributions.
Two factors stand out: the very low returns that Chinese households receive on their assets, and the relative lack of net transfer payments to the household sector after taxes are taken into account.


In the case of China “property income” for the household sector in 2019 and 2020 was around 4.5% of GDP, and closer to 3% of GDP on a net basis. In contrast, in the US, this number was about 15% of GDP. This reflects the higher returns on US financial and real assets. It is worth considering here the penchant China’s middle class has for sitting on vacant apartments and the amount of household net worth tied up in such vacant property; the low dividend payout ratios for listed Chinese companies; and, perhaps most importantly, the low bank interest rates paid to depositors and the lack of alternative avenues for revenue generation.
In other words, China’s high savings suffer from financial repression: capital controls force them to maintain their savings onshore and a state-owned financial intermediation industry pays them a poor return on their savings. This in turn reduces household income and therefore curtails their ability to spend. The Chinese saver has therefore been made by policy to finance huge government-driven investments, which are earning increasingly low returns.
When it comes to transfer payments, taxes, and pension and social security contributions, there are key differences between the United States and China. In the US, pension contributions coming from employers are added to wages and salaries accounting even though they are unavailable to spend. In China, these are deducted from income. The result is that in the United States, on a net basis, household income is augmented by benefits and pension contributions by about 8% of GDP, while, in China, the transfer payments and contributions net each other off almost exactly. This is reflective of the different roles that the government sectors play in the respective economies – one state is voter-centric: the other heavily drives and embodies the corporate sector.

A third structural difference is that, in China, the “value added created directly by the household sector” is equivalent to about 20% of GDP, whereas in the US, the “proprietors income” line is about 7% of GDP. This reflects the large amount of economic activity in China that is carried out through unincorporated businesses and the self-employed. In contrast, salaries, and wages in China account for just 38% of GDP versus 44% in the United States. Added together, these two numbers produce a roughly equivalent share of GDP (58% versus 52%) for both economies, but it is possible that the less formally structured part of the Chinese economy induces more precautionary savings and also potentially more investment-related savings that are used to grow unincorporated businesses. This last point is reinforced by the fact that small businesses (which are conflated with household income) find external funding hard to obtain.
The downside to China’s high propensity to save
China’s national savings peaked in 2008 at 52% of GDP.5 This was a sharp rise from the 34% in 1980. Since 2008, government sector savings have fallen and in 2019 were modestly negative. This accounted for the fall in national savings to 44% of GDP in 2019, since which time they have risen marginally to 45% of GDP.
Household sector savings, however, have continued to rise. The flow of funds data for 2019 put household savings at 21% of GDP or 35% of disposable income. This is a continuation of a trend of rising household savings that has been rising since the economic reforms of the late 1970s.
Over the years a rich literature has developed to try and explain China’s high savings rate. It appears probable that the high propensity of China’s households to save is a function of four key factors:
Firstly, in general, Asian economies tend to enjoy higher savings rates, irrespective of their state of development, than those of the West. China’s savings rate over the past 20 years, though, has been so exceptionally high, even by Asian standards, that such cultural factors cannot fully explain China’s gap with the West. Taiwan’s household savings rate in 2019, for example, was 21% compared to China’s 35%.
Secondly, as China began its economic reforms, citizens found the “iron rice bowl” – social services associated with state employment – increasingly depleted. With no reliably available alternative safety net, precautionary savings drove the rate higher. This desire for a “rainy day fund” was augmented by the uncertainty that economic reform created. China’s current deep economic malaise is now compounding these perennial worries for consumers.
Related Article

Thirdly, studies have shown that higher-income households have a higher propensity to save.6 As income inequality in China has sharply risen, a greater share of household income has gone to the households with the highest propensity to save. This impacts the overall household savings rate.
Finally, demographics: As a large percentage of China’s population finds itself within 20 years of retirement age, the desire to save to provide for old-age income has been an additional factor. China’s erstwhile one-child policy, which is estimated to leave one grandchild supporting four grandparents, combined with the cost of urbanization, accelerate the desire to increase old-age savings as traditional structures of family support break down.
While each or all these factors have the potential to explain the high propensity of China’s households to save, the underlying factors are not unique to China.
Conclusion: Big state, small savers
China’s political economy is stacked against the consumer. In democracies, the ballot box helps to protect and reflect consumer interests. This does not necessarily make democratic governments immune from capture by producer interests, but it acts as a powerful check. In China, the state-controlled undervaluation of the exchange rate is a function of the Chinese Communist Party’s desire to run current account surpluses and pursue export-oriented growth: it penalizes consumption by diminishing the purchasing power of the Chinese currency.
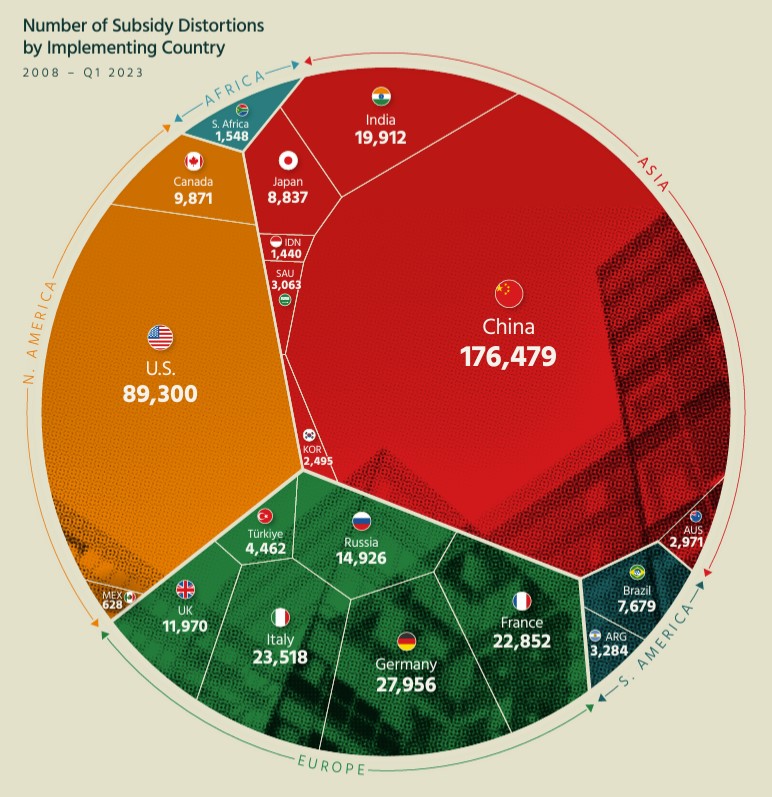
Massive industrial subsidies, handed out by the state to favored state-controlled corporations, represent a transfer payment to the corporate sector. China’s industrial subsidies are many times higher than in most advanced economies.
State control over the allocation of capital through ownership of intermediaries and powerful means of government suasion leave small businesses starved of loans that the state prefers to confer on its large state-owned companies. Economic expansion is funded at the expense of households and consumers.
Policy makers in China toiling on and hoping for a sharp and dramatic rise in consumption expenditure among the Chinese should therefore not be surprised that it is the Chinese state’s own mercantilist economic structure that is causing China’s massive consumer slump – and their failure to rectify it.
***
[1] World Bank database.
[2] BEA personal income and expenditure data.
[3] NBS year book.
[4] NBS statistical year book 2021 table 3-18.
[5] World Bank database.
[6] See for example: IMF working paper: China’s high savings: Drivers, prospects and policies. 2018.
© The Hinrich Foundation. See our website Terms and conditions for our copyright and reprint policy. All statements of fact and the views, conclusions and recommendations expressed in this publication are the sole responsibility of the author(s).

Stewart Paterson is a Research Fellow at the Hinrich Foundation who spent 25 years in capital markets as an equity researcher, strategist and fund manager, working for Credit Suisse, CLSA and most recently, as a Partner and Portfolio Manager of Tiburon Partners LLP.
Have any feedback on this article?